Water Supply Outlook November 2016
Updated: November 9, 2016
Recorded natural runoff volumes from March to September 2016
Natural runoff volumes from March to September 2016 were generally much below average in the Milk River, Oldman River, Bow River, Red Deer and the North Saskatchewan River basin with the exception of the Bighorn and Edmonton Reaches in the North Saskatchewan which was average.
Natural runoff volumes recorded from March to September 2016 for rivers in the Milk River basin ranked between 1 and 3 in 99 years of record. Rankings are from lowest to highest. The rivers in the Oldman River basin ranked between 12 and 25 in 99 years of record. The rivers in the Bow River basin ranked between 9 and 15 in 99 years of record. The rivers in the Red Deer River basin ranked between 20 and 25 in 99 years of record. The rivers in the North Saskatchewan River basin ranked between 9 and 45 in 100 years of record.
The average difference between all forecasts from the beginning of the year through August and the preliminary recorded natural volumes were 65% for the Milk River basin, 8% for the Oldman River basin, 15% for the Bow River basin, 18% for the Red Deer River basin, and 11% for the North Saskatchewan River basin.
The forecast accuracy between the first months forecast and the May forecast saw, on average, an increase in accuracy from 31% to 15% for the average difference between recorded and forecasted volumes.
Milk River basin- March - September recorded volumes were much below average for all three Milk Reaches.
- The recorded volumes were much lower than was forecasted during the January to August water supply outlook due to the relatively high spring snowpack numbers and then the significantly below normal summer precipitation amounts. The average difference between forecasted and recorded volumes was 65%.
- March - September recorded volumes were much below average for the Oldman and the St. Mary Rivers and below average for the Belly and Waterton Rivers.
- The recorded volumes were lower than was forecasted during the January to April water supply outlook and a mix of higher and lower than those forecasted from May through August. The average difference between forecasted and recorded volumes was 8%.
- March - September recorded volumes were much below average for all reaches.
- The recorded volumes were lower than was forecasted during the January to April water supply outlook and a mix of higher and lower than those forecasted from May through August. The difference between forecast and recorded volumes were on average 15%.
- March - September recorded volumes were much below average for the Red Deer River at Dickson Dam and the City of Red Deer.
- The recorded volumes were lower than was forecasted in February and March but higher than the foreasts from April to August. On average the difference between the forecasted and recorded volumes was 18%.
- March - September recorded volumes were average for Lake Abraham (Bighorn Reservoir) and the North Saskatchewan River at Edmonton, much below average for the Brazeau Reservoir.
- The recorded volumes were higher than forecast for Lake Abraham , and and a mix of greater than and lower than forecast for the Brazeau Reservoir. This was due to the low spring snowpack and the two late season rain storms in July and August. On average, the difference between the forecasted and recorded volumes was 11%.
Note: The recorded 2016 natural flow volumes are preliminary and subject to change.
Check our Forecaster's Comments for updated information regarding runoff conditions.
Precipitation
Contoured maps of precipitation amounts and as a percent of normal for the past month and for current and recent seasons are available here. Maps of precipitation amounts for the most recent day, week and month to date are available here.
Soil Moisture
Alberta Agriculture models soil moisture for non-mountainous, agricultural areas of Alberta. Modelled soil moisture compared to average as of October 31, 2016 is available here.
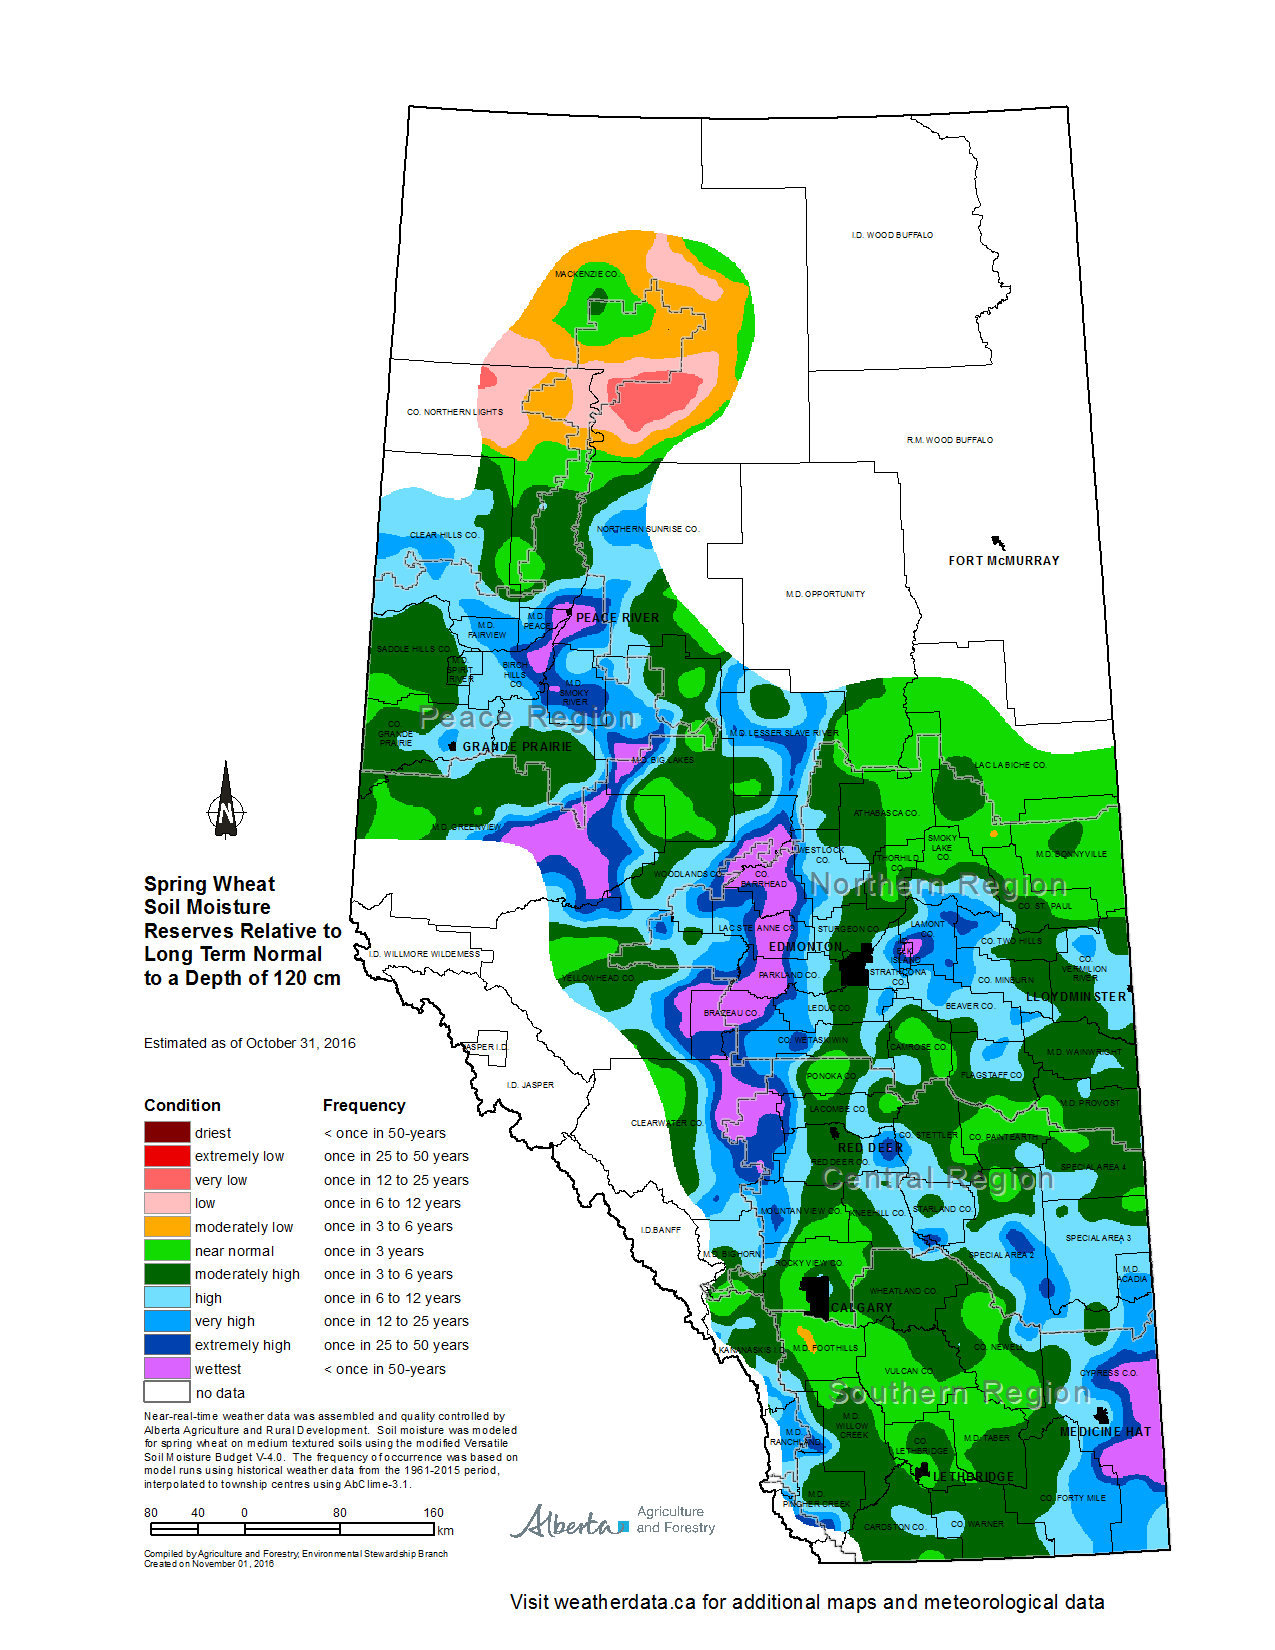
Long Lead Precipitation Outlooks
Environment Canada (issued on October 31, 2016): temperature and precipitation for the November 2016 through January 2016 period:
- below normal precipitation in the Cypress Hills and above normal precipitation in the northern east slopes and Lake Athabasca region.
- above normal temperatures for all of Alberta.
National Oceanic and Atmospheric Administration (NOAA) (issued on October 20, 2016): equal chance of above normal, normal and below normal temperatures. There is an equal chance of above normal, normal and below normal precipitation for the province except for southern Alberta, which is above normal for the November 2016 through January 2016 period.
Climate indicators: The NOAA reported on October 13, 2016 that La Nina is favored to develop (~70% chance) during the Northern Hemisphere fall 2016 and slightly favored to persist (~55% chance) during winter 2016-2017.
Note that forecasting weather for such a long time period into the future is very difficult, and so the historical accuracy has been variable, dependent on location and time period, and is often low, more so for precipitation than temperature. Environment Canada provides an assessment of their forecast method's historical accuracy on their website.
Reservoir storage
Water storage volumes in the major irrigation and hydroelectric reservoirs of the Milk, Oldman, Bow, Red Deer North Saskatchewan, and Athabasca River basins is updated each weekday and is available in the Provincial Reservoir Storage Summary.
Questions
Background information on the Water Supply Outlook is available in Frequently Asked Questions
Media Contact:
Communications Division, Alberta Environment and Parks
Phone: (780) 427-8636